Purpose/Overview
Overview Video (click this link)
My Screeners is a team-performance view that gives managers real-time visibility into the work being completed by their screening teams.
Designed for managers of screening teams, the feature provides a consolidated view of team activity without requiring managers to review individual screeners separately. Managers can monitor the team's progress, compare current activity against recent performance, identify productivity patterns, and drill into an individual screener's performance.
At a glance, My Screeners provides:
- Tickets completed, including tickets Cleared and Assigned/Dispatched to the field
- Tickets remaining for the selected period
- Average daily completed tickets based on the last five working days
- Hourly completion activity
- Completion totals by individual screener
- Individual screener performance when a team member is selected
- Performance views for different time periods
This provides managers with a centralized view of screening activity and helps them review and manage team performance throughout the day.
Navigation Path:
To access this feature: Login > Workload > Team
Things to Know:
- My Screeners is intended for managers of screening teams.
- Access to individual screener information depends on the user's configured permissions and team-management access.
- The source documentation does not specify the exact role or permission name required.
- The screen initially displays performance for the team as a whole. Selecting a screener from the My Screeners list changes the view to that individual's performance.
- The Average Daily Completed metric is based on the team's average completed volume over the last five working days. This provides a recent benchmark for understanding how the current day is tracking.
Key Benefits/Use Cases:
Monitor Team Progress
Managers can see how many tickets the screening team has completed and how many remain for the selected period.
Identify Productivity Patterns
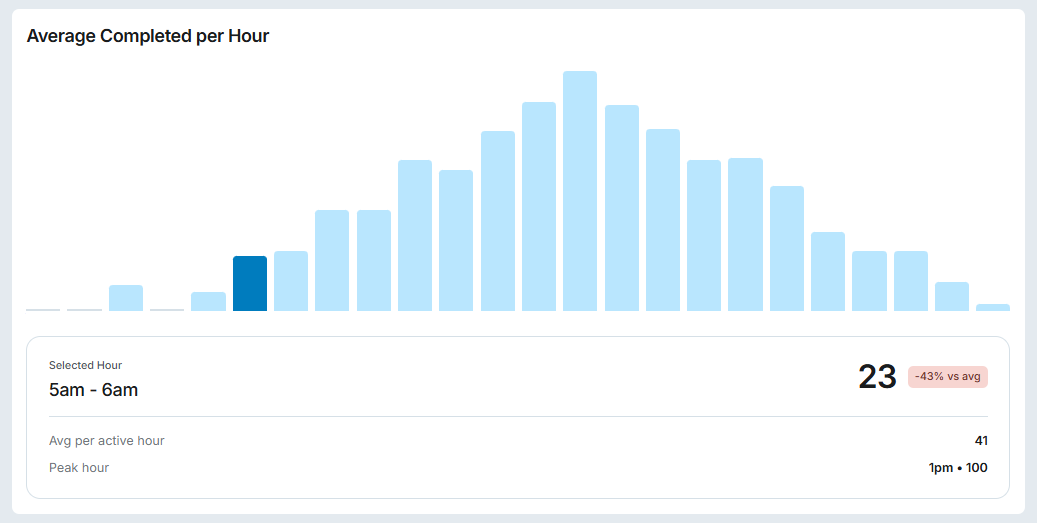
The Average Completed per Hour chart shows when tickets are being completed throughout the day. Managers can select an hour to view its completion total and compare it with the team's average.
Review Individual Screener Performance
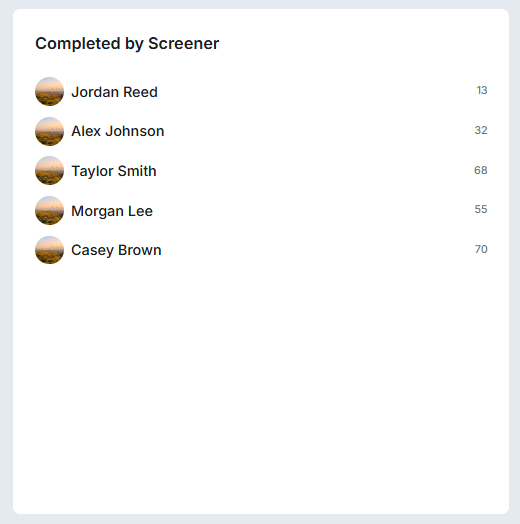
The Completed by Screener panel displays the total volume completed by each team member. Selecting a screener changes the dashboard to that individual's statistics.
How It Works:
Step 1 – Open My Screeners
Navigate to: Irth → Workload → Team
The dashboard opens with the team's current performance information.
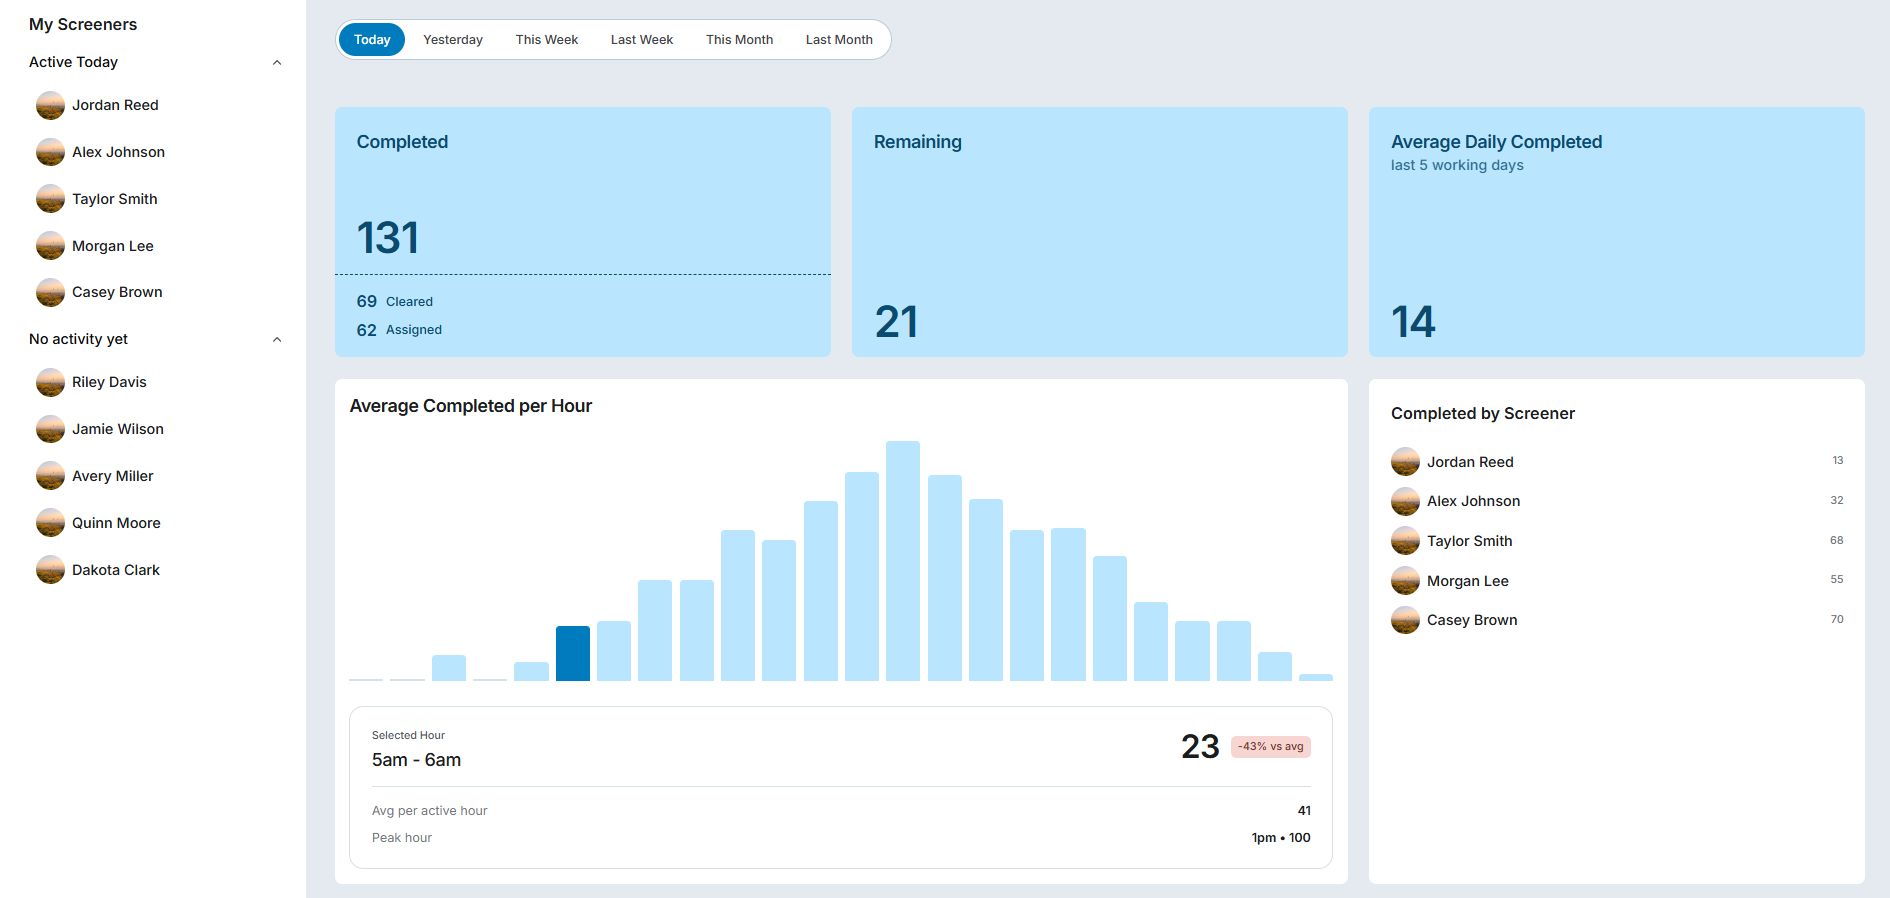
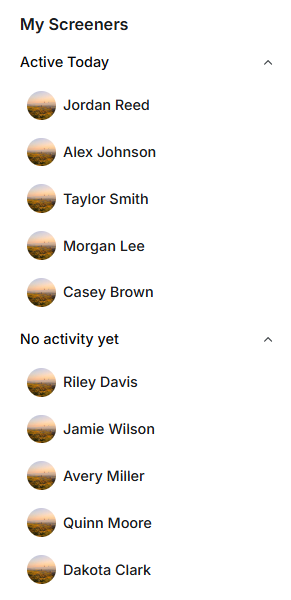
The left-side My Screeners panel lists team members and groups them based on their current activity.
Step 2 – Select the Time Period
Use the time-period selector at the top of the dashboard to change the reporting period.
Available options include:
- Today
- Yesterday
- This Week
- Last Week
- This Month
- Last Month
- Custom date range, where available
The dashboard updates to display performance for the selected period.

Step 3 – Review Team Performance Summary
The performance summary cards provide an at-a-glance view of the team's activity for the selected time period.
The summary includes:
- Completed – Displays the total number of tickets completed by the team, with a breakdown of tickets that were Cleared and those Assigned/Dispatched to the field.
- Remaining – Shows the number of tickets that are still outstanding for the selected period.
- Average Daily Completed – Displays the team's average number of completed tickets based on the last five working days, providing a recent benchmark for reviewing the team's current activity.
Managers can review these metrics together to quickly understand the team's current workload, completed activity, and recent completion benchmark.

Step 4 – Review Hourly Completion Activity
The Average Completed per Hour chart shows ticket completion activity throughout the selected period.
Managers can select an individual hour to view additional information, such as:
- Completed tickets for the selected hour
- Average completed per active hour
- Peak completion hour
The hourly view helps managers identify periods of higher activity and periods where completion volume is lower than the team's average
Step 5 – Review Performance by Screener
The Completed by Screener panel displays completed ticket volume for each member of the screening team.
Managers can use this view to understand the distribution of completed work across the team.
Step 6 – View an Individual Screener
Select a screener from the My Screeners list.
The dashboard switches from the team-level view to the selected individual's statistics. The same performance information is then displayed for that screener, including:
- Completed tickets
- Remaining tickets
- Average daily completed
- Hourly completion activity
This allows managers to move between team-level trends and individual performance without leaving the My Screeners screen.
Step 7 – Compare Performance Over Time
Change the selected date range to review screening activity across different periods.
Managers can use the available time periods to identify changes and patterns in team or individual activity over time.
Related Features/Next Steps:
FAQ/Troubleshooting:
Q: What is My Screeners used for?
A: My Screeners gives managers a centralized view of screening-team activity, including completed tickets, remaining work, hourly completion activity, and completion volume by screener.
Q: What does the Average Daily Completed value represent?
A: It represents the team's average number of completed tickets based on the last five working days. It provides a recent benchmark for reviewing current performance.
Q: Can I view the performance of an individual screener?
A: Yes. Select a screener from the My Screeners list. The dashboard switches to that person's statistics, including completed, remaining, and hourly performance information.
Q: Can I review historical screening activity?
A: Yes. My Screeners supports different time periods, including today, yesterday, weeks, months, and a custom range where available.
Q: What does the Average Completed per Hour chart show?
A: The chart shows when tickets are being completed throughout the day. Selecting an hour provides additional information for that period, allowing managers to compare the selected hour with the team's average and identify peak or lower-activity periods.
Q: What does the Completed by Screener section show?
A: It shows the total volume of completed screening work for each team member. Selecting an individual screener also changes the main dashboard to that person's performance view.
Questions? Contact us!

Was this article helpful?
That’s Great!
Thank you for your feedback
Sorry! We couldn't be helpful
Thank you for your feedback
Feedback sent
We appreciate your effort and will try to fix the article